The topic of Mixed Models is an old-friend of this blog, but I want to focus today on the R code for these models.
Amongst all the packages that deal with linear mixed models in R (see lmm, ASReml, MCMCglmm, glmmADMB,…), lme4 by Bates, Maechler and Bolker, and nlme by Pinheiro and Bates are probably the most commonly used -in the frequentist arena-, with their respective main functions lmer and lme.
I am still unsure as to which one I would choose – if I had to -, but I am sharing here a summary of some of their capabilities, in case it can be of help:
Model specification
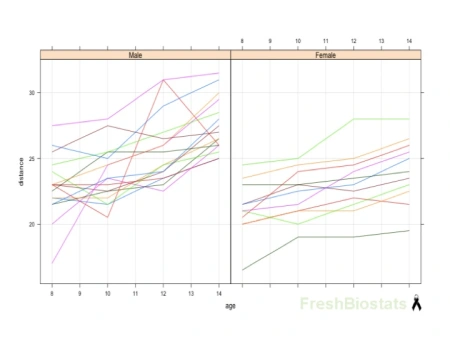
I will be using for all of the following examples the balanced dataset Orthodont from the package nlme, which reflects the change in an orthodontic measurement over time for a sample of 27 children (see Fig. 1).
Fig. 1. Spaghetti plots. Distance vs age by gender – dataset Orthodont
For simplicity´s sake, I will consider the following initial models with a simple random factor (please see ref. [3] for centering and further analysis):
model_lmer<-lmer(distance~age+Sex+(1|Subject),data=Orthodont)
model_lme<-lme(distance~age+Sex, random=~1|Subject,data=Orthodont)
Tests
- lmer
The results for t-tests and F-tests based on Restricted Maximum Lilkelihood (REML) can be found by using the following lines of code (you can add REML=FALSE to change this default setting):
summary(model_lmer)
…
Fixed effects:
Estimate Std. Error t value
(Intercept) 17.70671 0.83391 21.233
age 0.66019 0.06161 10.716
SexFemale -2.32102 0.76139 -3.048
…
(Please notice that the reference category in Sex can be changed by using relevel).
anova(model_lmer)
Analysis of Variance Table
Df Sum Sq Mean Sq F value
age 1 235.356 235.356 114.8383
Sex 1 19.034 19.034 9.2875
- lme
Conditional t-tests and F-tests are used for assessing the significance of terms in the fixed effects in lme.
Both F and t conditional tests results are based on REML conditional estimate of the variance. This option will be the default, but we can specify method=”ML” for Maximum Likelihood estimates.
For the results from the conditional t-test testing the marginal significance of each fixed effect coefficient with the other fixed effects in the model, we can use:
summary(model_lme)
…
Fixed effects: distance ~ age + Sex
Value Std.Error DF t-value p-value
(Intercept) 17.706713 0.8339225 80 21.233044 0.0000
age 0.660185 0.0616059 80 10.716263 0.0000
SexFemale -2.321023 0.7614168 25 -3.048294 0.0054
…
For the results from the conditional F-test testing the significance of terms in the fixed effects model (sequentially by default), we can use:
anova(model_lme)
numDF denDF F-value p-value
(Intercept) 1 80 4123.156 <.0001
age 1 80 114.838 <.0001
Sex 1 25 9.292 0.0054
(The argument type would also allow us to specify marginal F-tests).
These conditional tests for fixed-effects terms require denominator degrees of freedom, which will be the focus of the next section.
Degrees of freedom
- lme
The denominator degrees of freedom correspond to “the classical decomposition of degrees of freedom in balanced, multilevel ANOVA designs” [3]. It is worth noticing that the values for these degrees of freedom do not match those provided by other software procedures such as SAS PROC MIXED (see discussions on the topic here and here).
Additionally to the denominator degrees of freedom aforementioned, conditional F-tests also require numerator degrees of freedom defined by the term (see output from previous section).
- A good explanation regarding the reporting of degrees of freedom in lmer is given by the author of the package in this article (page 28).
p-values
- lme reports p-values (see previous output), whereas
- lmer doesn’t but this has been justified by Bates.
Random effects
- lme allows for nested random effects in a very straightforward way (random=~1|a/b, where factor b is nested in a). Crossed random effects on the other hand, can be dealt with through “a combination of pdBlocked and pdldent objects” [3].
- Nested random effects can again be easily modelled in lmer (+(1|a/b)). Crossed random effects are handled in an easier way than in lme (+(1|a)+(1|b)). You can find further explanations in [2].
Random effects plots
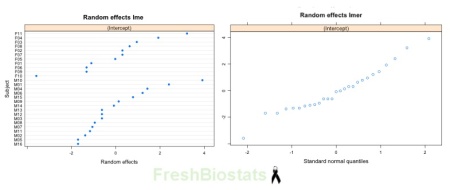
Two different approaches to the plotting of the random effects can be obtained through the following lines of code:
- lme
plot(ranef(model_lme))
- lmer
qqmath(ranef(model_lmer))
Fig. 2. Random effects plots for model_lme and model_lmer.
Residuals plots
- lme allows to plot the residuals in the following ways:
res_lme=residuals(model_lme)
plot(res_lme)
qqnorm(res_lme)
qqline(res_lme)
plot(model_lme)
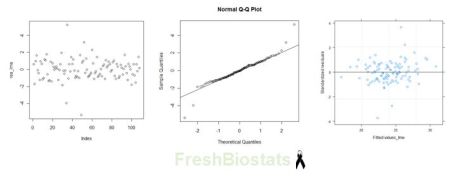
 Fig. 3. Residual plots for model_lme.
- We can also plot the first two graphs in lmer, but the last line of code does not seem to work with this function.
Correlation structure
- We can easily incorporate correlation structures in lme. Mostly used for temporal correlation structures are corAR1, corCAR1 (autoregressive and continuous autoregressive correlation structures of order 1), and corCompSymm (compound symmetry).
model_lme<-lme(distance ~ age + factor(Sex),random = ~ 1 | Subject, cor=corAR1(0.6,form=~1|Subject),data = Orthodont)
…
Correlation Structure: AR(1)
Formula: ~1 | Subject
Parameter estimate(s):
Phi
0.05849311
…
Further structures available can be found in the help for corClasses.
- There is not an argument in lmer for doing this, but guidance on how to incorporate the structures can be found here.
Heteroscedasticity
- lme allows you to model heteroscedasticity using the varFunc object, but
- it is not covered by lmer.
Although some other differences could be mentioned, future posts will cover those other matters.
The following books have been found extremely useful:
[1] Badiella, L., Sánchez, J.A. “Modelos mixtos con R versión 0.3” ( from the course “Modelos Mixtos utilizando R”)
[2] Bates, D. (2010). lme4: Mixed-effects modelling with R. Springer
[3] Pinheiro, J.C. and Bates, D.M. (2000). Mixed-Effects Models in S and S-Plus. Springer
[4] Zuur, A.F. et al. (2009). Mixed effects models and extensions in ecology with R. Springer
I will be more than happy to read your comments and tips! 🙂


Great post Altea!!! Nowadays, if you only want to fit a linear o no linear mixed model (LMM, LNMM) I think it’s more appropriate to use the nlme package of Pinheiro (J. C. Pinheiro and D. M. Bates. Mixed-Effects Models in S and S-PLUS. Springer, 2000), but if you want to fit a Generalized linear mixed model (GLMM) it’s better the lme4 package. In spite of that, we have to take into account that the lme4 is in development and the lme4 developers will announce a scheduled release of lme4 version 1.0 soon. The new version will tend to have fewer problems with false convergence and more flexibility for exploring and fixing convergence problems. Latsly, if somebody is interested in the introduction of mixed models, I would like to recommend the course of Badiella, L., Sánchez (reference number one). Thanks for you post!!!!
Thanks very much, Martí, for your kind and very helpful comment!!
I completely agree with your suggestions.
Also, great news about the new version of lme4, thank you for sharing, so much looking forward to that!
The course was indeed of great help for me too, I strongly recommend it!
[2] Bates, D. (2010). lme4: Mixed-effects modelling with R. Springer
This book is still vaporware.
Thank you very much, Dieter, for your comment.
We have indeed accessed the electronic version available on the lme4 repository:
Click to access lrgprt.pdf
Any other references will be very welcome!
This code has an error
“model_lme<-lme(distance~age+Sex, random=~Subject,data=Orthodont)"
It should be "model_lme<-lme(distance~age+Sex, random=~1|Subject,data=Orthodont)"
Indeed, many thanks nitro for pointing out the typo! Fixed now 🙂
Thanks very much for sharing to us on mixed models using R. I am though learning it. So far I do not understand how to obtain covariance estimates. In addition, I use lsmeans(sorry am SAS user) or doBy to obtain mean estimates? can you comment on these?
Thanks so much for your comment, Abraham, and sorry for my late reply.
I am afraid I am not a SAS user so I can´t be of much help. In R, you could use extract.lme.cov (find more info in the following link: http://stuff.mit.edu/afs/sipb/project/r-project/arch/sun4x_59/lib/R/library/mgcv/html/extract.lme.cov.html)
Will investigate further and let you know if I find some SAS tips regarding this!
The absence of ls means is by design:
http://r-project.markmail.org/thread/quectj4sslht6fft
Douglas Bates: I am having difficulty grasping how you obtain a prediction from a model involving a factor ‘d’ without assigning a value to that factor. I suppose that someone who understands the deep magic of quantities like SAS’s LS-means may be able to tell you what you want to know but I can’t.
Thank you s much for that, Dieter!
Hi Altea. I have a lme model, with 2 fixed and 1 random factor, no significant interaction.
m3 <- lme(LengthT10 ~ Temp+pH, random=~1|Tank)
My question is, can I do
anova(m3)
and report F and DF from there? Is this reliable information from lme?
Thank you
Hi Fatima, thank you for your comment. You can, for a further insight you can find the details on how lme calculates the df on pages 91 and 92 of Pinheiro and Bates (2000):
http://books.google.co.uk/books?id=N3WeyHFbHLQC&printsec=frontcover&dq=pinheiro+bates&ei=GKUxSqujF4WKygSSnrCUBg&redir_esc=y#v=onepage&q=pinheiro%20bates&f=false
I hope this helps!
Thank you Altea. It helped.
hi, how to get P-values for anova (lmer_mod). Also how to get pseudo R^2 value for each model of lmer.
Thanks
Hi Altea, thanks alot for this brief introduction. I have a quick question, I have done GLS with AR1 errors on my data and I would like to know the exact details of REML used in GLS command. Is there a book or paper I can read specific to that implementation. I would be very obliged when u guide in right direction!
Sorry I missed your comment, you have a reference and discussion on the following link: https://stackoverflow.com/questions/1395102/gls-vs-lme-in-the-nlme-package
Hi, how to get standarized (beta) coefficients for LMER model (linear mixed model or GLMM). I know for linear model (LM) but dont know for the mentioned one. Thanks
There are some functions to help you with that in package lmerTest.
Reblogged this on Daniel P Newman.
How to include interaction term in lme?
Many thanks for your question Lakshmi and for your helpful answer Martí (below). A version of the example on the post using lme with an interaction would be: model_lme<-lme(distance~age*Sex, random=~1|Subject,data=Orthodont)
Example interaction: https://stats.stackexchange.com/questions/187996/interaction-term-in-a-linear-mixed-effect-model-in-r
Many thanks again Martí, very helpful and interesting link! I will update the post with a subsection on interactions later on.