Featured

Increasing your research visibility -through a personal website with GitHub-

Letting the world know about your work is important. This is true for any field of research, but for those of us working in any kind of computing-related field, it becomes even more relevant.

Professional networks, distribution lists, blogs and forums are an excellent way to keep up to date with research in your field (you can check a previous post on this topic here). Even social networks can be a great way to do so, depending on how you decide to use them. For instance, you can find quite a number of PostDoc positions posted on twitter.

There is another important aspect to consider as well. By being an active part of the community, not only do you gain visibility, but you also get the chance to contribute in return… How many issues have you solved through StackOverflow, Biostars, R-bloggers posts and so on? How many articles were you able to get through ResearchGate?

Back to the matter at hand, I have just recently found out about how to create a personal website with GitHub . If, like me, you do not know much about HTML programming, you might want to use the automatic page generator. I can tell you: if you have already figured out the content you want on it, and providing you already have a GitHub account, it will take you less than 5 minutes, (see a previous post on how to create an account here). Starting from a simple static web -simple is beautiful-, it can evolve into more sophisticated sites.

Featured

More on handling data frames in R: dplyr package

I am currently taken an edX course, which is becoming one of my favorite online platforms, along with coursera. This time it is “Data Analysis for Genomics”, conducted by Rafael Irizarry, you might know him by his indispensable Simply Statistics blog. The course has just started, but so far the feeling is really good. It has been through this course that I have found about a new package by the great Hadley Wickhamdplyr. It is meant to work exclusively with data frames and provides some improvements over his previous plyr package.

As I spend quite a bit of time working with this kind of data, and having written a post some time ago about how to handle multiple data frames with the plyr package, I find it fair to update on this one. Besides I think it is extremely useful, and I have already incorporated some of its functions to my daily routine.

This package is meant to work with data frames and not with vectors like the base functions. Its functionalities might replace the ddply function in plyr package (one thing to mention is that is not possible to work with lists yet –as far as I know-). Four functions: filter( ) – instead of subset- , arrange( ) –instead of sort -, select( ) –equivalent to using select argument in subset function-, and mutate( ) – instead of transform- are, in my opinion, reason enough to move to this package. You can check here some examples on using these functions. The syntax is clearly improved and the code gets much neater, no doubt about it.

Two other essential functions are group_by( ) that allows to group the data frame by one or several variables and summarise( ) for calculating summary statistics on grouped data.

You can find general information about the package at the rstudio blog or several other blogs talking about its goodness, here or here.

Not to mention its other great advantage, the speed, not a minor issue for those of us who work with extremely large data frames. Several speed tests have been perfomed (here and here),( and it seems to clearly outperform the speed of plyr or data.table packages***).


I am so glad to have found it… I hope you will be too!


***Additional speed tests results will be published soon since this statement might be wrong.

Featured

Analysis of PubMed search results using R

Looking for information about meta-analysis in R (subject for an upcoming post as it has become a popular practice to analyze data from different Genome Wide Association studies) I came across  this tutorial from The R User Conference 2013 – I couldn´t make it this time, even when it was held so close, maybe Los Angeles next year…

Back to the topic at hand, that is how I found out about the RISmed package which is meant to retrieve information from PubMed. It looked really interesting because, as you may imagine,this is one of the most used resources in my daily routine.

Its use is quite straightforward. First, you define the query and download data from the database (be careful about your IP being blocked from accessing NCBI in the case of large jobs!) . Then, you might use the information to look for trends on a topic of interest or extracting specific information from abstracts, getting descriptives,…

In order to try it out, I decided to get data regarding what has been published relating to Next Generation Sequencing. For doing so, I adopted the search terms proposed in the paper by Jia et al. Through the following code we can get the PubMed results for these search terms since 1980:

library(RISmed)
query = "(exome OR whole OR deep OR high-throughput OR (next AND generation) OR (massively AND parallel)) AND sequencing"
ngs_search <- EUtilsSummary(query, type="esearch",db = "pubmed",mindate=1980, maxdate=2013, retmax=30000)
QueryCount(ngs_search)
ngs_records <- EUtilsGet(ngs_search)
years <- Year(ngs_records)
ngs_pubs_count <- as.data.frame(table(years))

This code allow us to get published papers on this topic per year. By getting also data about the total number of publications per year, we are able to normalize the data. The complete R code, once the data are downloaded and edited can be found at  FreshBiostats GitHub Gist. In the next graph, we can see the publication trend for Next Generation Sequencing per year:

ngs_year

I was also curious about which ones would be the journals with the highest number of publications on this topic. Using the following code we can get the count of NGS publications per journal:

journal <- MedlineTA(ngs_records)
ngs_journal_count <- as.data.frame(table(journal))
ngs_journal_count_top25 <- ngs_journal_count[order(-ngs_journal_count[,2]),][1:25,]
Again, the complete code that allows us to normalize the data by the total number of publications per journal, as well as the following barplots showing the result, is available at our Gist:

ngs_publications_total

ngs_publications_normalized

You cand find some other examples using this package at Dave Tangs Bioinformatics blog. Additionally, some alternatives to the use of RISmed package can be found at R Chronicle and R Psychologist blogs.

Other potential applications of this package include creating a co-author network, as is described in Matthew Maenner´s blog.

Search and analyze carefully!

Featured

Keeping up to date with research in your field (Part II)

  • Online free courses/tutorials: there is plenty of material on line, which makes it sometimes difficult to filter what is really worthy. Here again, tips from blogs or colleagues from your network might serve as reference. Coursera is, in my opinion, one of the best platforms, due to the quality and versatility of its courses. There are several excellent courses related to Statistics and Data Analysis. Some of them are more general about R programming (e.g. Data Analysis,Computing for Data Analysis – both using R- ),but  there are also more specific ones (e.g. Design and Interpretation of Clinical Trials, Statistical Analysis of fMRI Data,.. you can check the full list here.

I would like to mention here some other resources available for those with a math/statistics background who might be interested in getting some insight into genetics. As we mentioned previously in other posts, it is critical to understand the data you are dealing with and these websites will help you with that:

An extensive list of additional Online Genetics Education Resources can be found at the NHGRI site

For those wanting to get an introduction to NGS, there is a Next Generation Sequencing Practical Course at EMB-EBI Train online. A more advanced tutorial, showing the use of R/Bioconductor  packages for High-Throuput Sequence Analysis can be found here.

There are, obviously, countless courses and tutorials about R and specific packages. Besides, GitHub is becoming more and more popular.By creating Gist on GitHub you can share your code quickly and easily, see a quick example here.

  • Webinars:  many commercial sites offer highly focused free Webinars that might be of interest. For instance both Science and Nature host webcasts regularly.

  •  Forums /discussion list: when you are stuck with something and you are not able to find a solution, specialized forums might come to the rescue. Either because your same question has been asked before, or because there is someone willing to help, you will most likely get your doubt solved. Two forums are particularly useful in my field, BioStar and SEQanswers. Talking about R programming, R-help from R Mailing List and Stack Overflow are two of the sites where you can found most of your doubts solved. Our life without them would be much more difficult for sure…

As I mentioned at the beginning of the previous post, it is sometimes difficult to find a balance between the time you spend learning and your more “productive” time. Besides for those of us whose work is also a passion, the line between work and personal interests becomes blurred quite often. And so we will spend much of our leisure time diving around new stuff that eventually will be useful in our work. Some might argue that the time spent in training or the amount of information you have access to might be overwhelming. Is it worth the effort? How much time should we invest in learning? Are we able to take advantage of what we learn? You can take a look at this video  for more elaborate thoughts on the subject.

I hope the information contained in these posts might be useful… Your suggestions on additional resources will be more than welcome!

Featured

Keeping up to date with research in your field (Part I)

No doubt about it, we must keep up with news and advances in our area of expertise. In this series of two posts I just want to introduce the ways I find useful in order to achieve this goal. Staying up-to-date means not only knowing what is being done in your field but also learning new skills, tools or tricks that might be applied. I will save for last some thoughts about getting a proper work-learning balance and potential impact on productivity.

  • Blogs. It might be an obvious one, but it is for sure one of my main sources of information. Several blogs I follow include: Getting Genetics Done, Genomes Unzipped, Our 2 SNPs, Wellcome Trust, R-BloggersSimply Statistics and many others mainly focused on biostatistics that you can find in our blog roll. Most of them are accessible through RSS feeds, if not through mail subscription.
  • Twitter. Most blogs have also a twitter account where you can follow their updates (so it might be an alternative). You can follow twitter accounts from networks of interest, companies or people working in your field too. For some ideas on whom to follow, go to our twitter!
  • PubMed / Journals alerting services. A keyword specific PubMed search can be just as relevant. Both available through email and RSS Feeds, you will get updates containing your search terms (for instance “Next Generation Sequencing”, “rare variant association analysis”, “Spastic Paraplegia”…). You can also get information about an author´s work or the citations of a given paper. You can find here how to do it.  An alternative is to set up alerts for Table of Contents of your journals of interests, informing of the topics of latest papers (Nature Genetics, Bioinformatics, Genome Research, Human Mutation, Biostatistics…) Accessing RSS Feeds through your mail app is straightforward -Mozilla Thunderbird in my case-.
  • Professional networking sites. Obviously, when it is all about networking, having a good network of colleagues is one of the best ways to keep up with job offers, news or links to resources. For instance through my LinkedIn contacts I receive quite a bunch of useful tips. Well selected LinkedIn groups are also a source of very valuable information and news, as well as companies in your area or work (pharma industry, genomic services, biostatistics/bioinformatics consulting). This is a more general site, but there are other professional sites focused on Research: ResearchGate and Mendeley. Mendeley in particular, apart from a networking site is an excellent reference manager. This, along with MyNCBI are the two main tools I use to keep my bibliography and searches organized.
  •  Distribution lists.  Apart from general distribution lists including one´s institution or funding agency, more specific newsletters or bulletins from networks as Biostatnet or  scientific societies you belong to, are a good source of news, events and so on, or even more restricted ones (for instance in my institution an R users list has been recently created).

To be continued next week …..

Featured

Sharing statistical analysis and results through web applications

I have to admit I am not completely comfortable with the RStudio IDE yet. However, RStudio projects are of great interest, and the new package Shiny – released last November- is no exception.

Shiny allows you to build web applications in R, so anyone might be able to access your analysis results through an interactive web browser interface. As they state in their website “…your users choose input parameters using friendly controls like sliders, drop-downs, and text fields. Easily incorporate any number of outputs like plots, tables, and summaries..”

The application is structured in two components: a user interface script named ui.R  and a server script – server.R. The first one deals with the input and output format, the second one contains the code to run the analysis.

I made a quick trial following the tutorial and my (very simple) web app was ready in no time. It is based on some of the examples of the SNPassoc vignette, an R package designed to perform genetic association studies. In this application, you can check the summary for a small set of SNPs and get both a plot showing the frequencies and the results of the association study for a given SNP.

By using Shiny, you can run your applications locally or share them with other users so they can run the applications in their own computers. There are several options to distribute your apps, you can check all of them here. In this case, the app can be accessed through the GitHub Git repository. Once the Shiny package is installed (along with the SNPassoc package used in this example) you just have to run the following code:

library(shiny)
shiny:: runGist('4e5e618431a59abe692b')

In my opinion this tool has great potential for sharing analysis results through an interactive and friendly interface.  It might replace files containing a lot of graphics and tables while saving time both to the data analyst and the end user. Have you tried it? Do you want to share your apps with us?

Dealing with strings in R

As I mentioned in previous posts, I often have to work with Next Generation Sequencing data. This implies dealing with several variables that are text data or sequences of characters that might also contain spaces or numbers, e.g. gene names, functional categories or amino acid change annotations. This type of data is called string in programming language.

Finding matches is one of the most common tasks involving strings. In doing so, it is sometimes necessary to format or recode this kind of variables, as well as search for patterns.

Some R functions I have found quite useful when handling this data include the following ones:

  • colsplit ( ) in the reshape package. It allows to split up a column based on a regular expression
  • grepl ( ) for subsetting based on string values that match a given pattern. Here again we use regular expressions to describe the pattern

As you can see by the arguments of these functions, it might be useful when manipulating strings, to get comfortable handling regular expressions. More information on regular expressions to build up patterns can be found at this tutorial and in the regex R Documentation.

Some other useful functions are included in the stringr package. As the title of the package says: “Make it easier to work with strings”:

  • str_detect ( ) detects the presence or absence of a pattern in a string. It is based on the grepl function listed above
  • fixed ( ) this functions looks for matches based on fixed characters, instead of regular expressions

Once again a Hadley Wickham package, along with reshape and plyr. The three of them containing a set of helpful features for handling data frames and lists.

This is just a brief summary of some options availabe in R. Any other tips on string handling?

Mining genomic databases with R

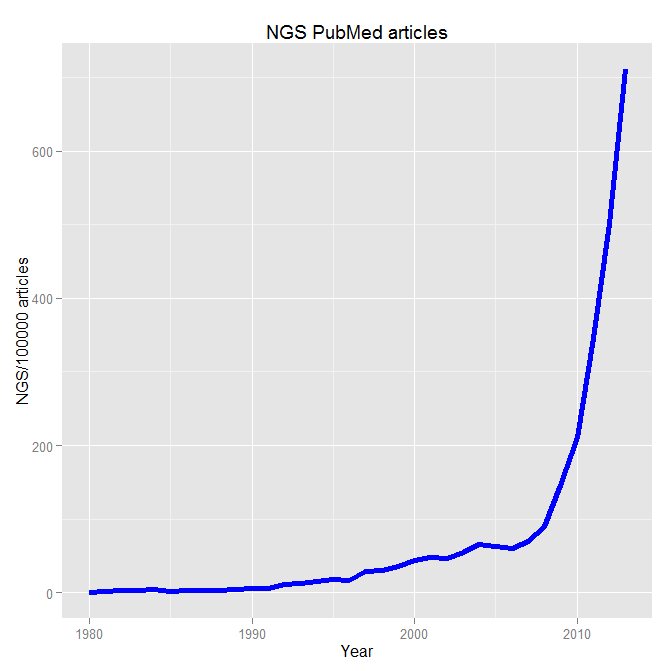
When dealing with genomic data, retrieving information from databases is a required endeavor.  Most of these repositories of genomic and proteomic data have very useful and friendly interfaces or browsers perfectly suitable for particular searches. But if you are working with high dimensional data e.g. NGS data, more efficient tools to mine those databases are required. R offers several packages that make this task straightforward.

NCBI2R is an R package to annotate lists of SNPs, genes and microsatellites. It obtains information from NCBI databases. This package provides quite useful functions for getting a quick glance at a given set of SNPs or genes, retrieving SNPs in a gene or getting genes belonging to a KEGG pathway (among some other features) as shown in the code below.

library(NCBI2R)
GetIDs("MAPT[sym]")
GetGeneInfo(4137)
mysnps <- GetSNPsInGenes(4137)
GetSNPInfo(mysnps)
myset <- GetIDs("KEGG pathway:Alzheimer´s disease")

biomaRt package, part of Bioconductor project, is an R interface to the well-known BioMart data management system that provides access to several data sources including Ensemble, HGNC, InterPro, Reactome and HapMap.

Most of analysis can be performed with just two functions: useMart() to define the dataset, and getBM() to perform the query. It performs onlique queries baed on attributes – values we are interested in retrieving-,  filters – restrictions on the query- and a given set of values of the filter. Once we define the dataset we are interested in, we can check all the filters and attributes available. Let´s say we want to look for those genes associated with an OMIM phenotype.

source( "http://www.bioconductor.org/biocLite.R")
biocLite("biomaRt")
library(biomaRt)
listMarts()
mymart <- useMart("ensembl",dataset = "hsapiens_gene_ensembl")
listFilters(mymart)
listAttributes(mymart)
getBM(attributes = c("entrezgene", "hgnc_symbol", "mim_morbid_description"), filters ="entrezgene", values = myset, mart = mymart)

Org.Hs.eg.db , which is also part of Bioconductor, is an organism specific package that provides annotation for the human genome. It is based on mapping using Entrez Gene identifiers. In a very similar way to biomaRt, it allows to query  the databases by means of the select() function specifying cols – kind of data that can be returned-, keytypes -which of the columns can be used as keys-  and a given key.

source("http://bioconductor.org/biocLite.R")
biocLite("org.Hs.eg.db")
library(org.Hs.eg.db)
keytypes(org.Hs.eg.db)
cols(org.Hs.eg.db)
select(org.Hs.eg.db, keys= "MAPT", cols = c("SYMBOL", "CHR", "CHRLOC", "UNIPROT"), keytype = "SYMBOL")

These three packages offer in many cases a good alternative to other well-known data mining systems such as UCSC Table Browser data retrieval tool. Besides, commands from these packages are quite simple, so even those not that familiar with R language can take good benefit from them.

Just a quick tip to finish – I have just found out about fread() function (data.table package) for reading large files. It really makes a difference!

Handling multiple data frames in R

I am not -yet- that highly skilled at programming in R, so when I run into a function/package that really meets my needs, well, that is quite a big deal. And that is what happened with the plyr package.

I often have to work with a high number of data frames. It is not about “big” statistics here, but just some basic descriptives, subsettings…  It has to do more with handling this amount of data in an easy and efficient way.

There are two routines when manipulating these data sets I find essential. The first one is being able to operate with all these data frames at once (eg. subsetting  for filtering) by creating lists.

So let´s say we have a certain number of data frames, file_1, file_2, … each of them with the same variables named  var1, var2,… and want to subset all of them based on a certain variable.

dataframes <- list.files(pattern = ”file_”)
library(plyr)
list_dataframes <- llply(dataframes, read.table, header = T, sep = "\t")
dimensions <- ldply(list_dataframes, dim)
filter <- llply(list_dataframes, subset, var1 == ”myvalue”)
selection <- llply(list_dataframes, subset, select = c(var1,var3))

No need for “for” loops here!  It is certain much neater and easier this way. More information about llply, ldply or laply can be found at the plyr R tutorial. Much has been said about its advantages in other blogs, you can check it here or in my “indispensable” gettinggeneticsdone.

The second one would allow us to identify common values between those data frames. The first function that comes to mind is merge. Again several useful posts about it (gettinggenetics done, r-statistics) and it sure serves the purpose in many cases. But quite frequently, you find yourself in the situation where you have got several data frames to merge ;  merge_all and merge_recurse in the reshape package overcome this problem. There is an excellent R wiki entry covering this topic.
As an alternative to merge, join (again in the plyr package), lets you specify how duplicates should be matched.

Note that both packages- plyr and reshape- are developed by Hadley Wickham, ggplot2´s creator.

These functions have become part of my daily routine and they definitely save me a lot of trouble. I have yet to explore another package I read great things about: sqldf.

Do you have any other suggestions on manipulating data frames?

Approaching Statistical Genomics

I am sure you heard about the ENCODE project. It has been all around the news last month. Along with other milestones like the Human Genome Project, HapMap or 1000 Genomes, it is a good example of the level of understanding of the human genome we are achieving.

Next Generation Sequencing (NGS) allows DNA sequencing at an unprecedented speed. Genomic projects involve mainly exome (protein coding regions of the genome) sequencing right now, but the technology is rapidly evolving, and soon enough it will be cost-efficient to sequence whole genomes. Undoubtedly these projects will account for a good part of genomics research fundings.

So far a quick and brief overview of what is happening in genomics right now and what is about to come in the near future. But, what does all this mean from a statistical point of view? To say it plain and simple: a huge amount of data will need to be properly analyzed and interpreted.

Between 20.000 and 50.000 variants are expected per exome. Examining an individual´s exome in the search for disease-causing mutations requires advanced expertise in human molecular genetics. We could wonder what happens when we talk about comparing multiple sequence variants among members of families (e.g. linkage analysis for monogenic disorders) or populations (e.g. case-control studies for complex disorders). High dimension data are nowadays the rule, and sooner or later anyone working in genomics will face problems that require knowledge in bioinformatics and in specific statistical methods to be solved.

Since one of my fields of interest is the identification of susceptibility genes for complex disorders, I thrive on the new challenges that NGS presents, in particular the possibility to perform rare variants analysis. Ron Do et al. have just published a complete review on this subject.

I am just focusing here on what is usually referred to as tertiary analysis in a NGS pipeline, i.e. analyzing and extracting biological meaning of the variants previously identified. However, we should not forget the opportunities in the development of base calling, sequence alignment or assembly algorithms.

Furthermore,  DNA/exome-sequencing is just one piece of the cake. Some other statistical issues arise in the analysis of other high-throughput “omics” data such as those coming from RNA-seq, ChIP-seq or Methylation-seq studies.

The message of this post: to date, the capacity for generating genomic data is far beyond the ability to interpret that data. Whether you are interested in developing new statistical methods or considering a more applied career, there is no doubt that statistical genomics is a hot field right now!

As an extra incentive for those coming from a mathematical background, you will get to work closely with geneticists, molecular biologists, clinicians and bioinformaticians among others. Interdisciplinarity being one of our blog mottos, statistical genomics wins by far…