While researching on scale-free networks, I found this book, which happens to include the very interesting article The structure of scientific collaboration networks and that will serve me as a follow-up to my previous post on social networks here.
Collaborative efforts lie in the foundations of the daily work of biostatisticians. As such, the analysis of these relationships –lack of interaction in some cases- appears to me as fascinating.
The article itself deals with the wider community of scientists, and connections are understood in terms of papers´ co-authorships. The study seems to prove the high presence of small world networks in the scientific community. However short the distance between pairs of scientists I wonder, though, how hard it is to cover that path, i.e., are we really willing to interact with colleagues outside our environment? Is the fear to step out of our comfort zone stopping us from pursuing new biostatistical challenges? Interestingly, one of Newman´s findings amongst researchers in the areas of physics, computer science, biology and medicine is that “two scientists are much more likely to have collaborated if they have a third common collaborator than are two scientists chosen at random from the community.”
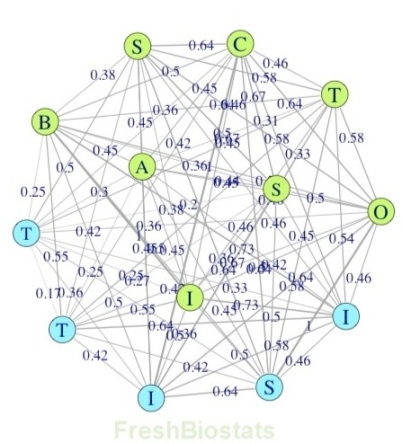
Interaction patterns analyzed through social networks diagrams like the one shown in Fig 1., can give us a hint on these patterns of collaboration, but can also be a means towards understanding the spread of information and research in the area (ironically, in a similar fashion to the spread of diseases as explained here). 
Fig.1. Biostatistics sociogram (illustration purposes only; R code adapted from here and here)
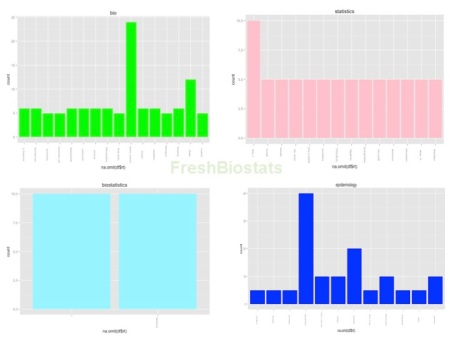
In my previous post on the topic, I focused on the great Linkedin inmaps. I will be looking this time at Twitter and an example of the huge amount of information and the great opportunities for analysis that the platform provides. R with its package twitteR makes it even easier… After adapting the code from a really useful post (see here), I obtained data relating to twitter users and the number of times they used certain hashtags (see plots in Fig. 2).
Fig.2. Frequency counts for #bio (top left), #statistics (top right), #biostatistics (bottom left), and #epidemiology (bottom right). Twitter account accessed on the 17th of May 2013.
Although not an exhaustive analysis, it is interesting to notice the lower figures for #biostatistics (turquoise) and #statistics (pink), compared to #bio (green) and #epidemiology (blue) for example (please notice the different scales in the y axis for the four plots). It makes me wonder if the activity in the field is not our strongest point and whether it would be a fantastic way to promote our profession. I am certainly convinced of the great benefits a higher presence in the media would have, particularly in making it more attractive for the younger generations.
That was just a little peek of even more exciting analysis to come up in future posts, meanwhile see you on the media!
Do you make any use of the social networks in your work? Any interesting findings? Can´t wait to hear them all!


Incredible post!! Good job!!
Thank you so much, really glad you enjoyed it!!
Pingback: Analysis of PubMed search results using R | FreshBiostats